Hi all,
I hope you’re doing good.
After a client migrated their main database to RAC (they just did the switchover from Single Instance to RAC using Data Guard), they started complaining about some performance issues with a very specific business function.
Their team was trying to check GV$SESSION_WAIT and GV$SESSION, but they were unable to find the issue.
I jumped into the call and used a script by Tanel Poder that I really like to work with: dashtop.sql
First, I verified what was going on in the whole DB:
@dashtop "session_state,event,sql_id" "session_type='FOREGROUND'" "TO_TIMESTAMP('10-03-2025 17:45:00', 'DD-MM-YYYY HH24:MI:SS')" "TO_TIMESTAMP('10-03-2025 18:15:00', 'DD-MM-YYYY HH24:MI:SS')"The output is shown below:
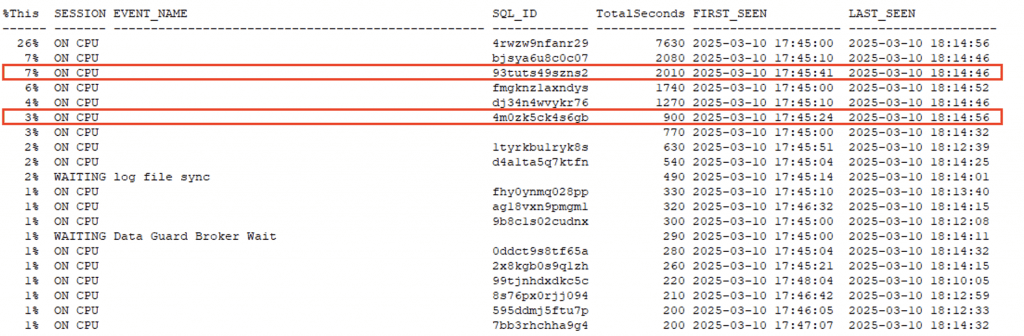
We can see that the DB, of course, had some activity, but the query that seemed to be the problematic one was the third in the ASH output. We also have another query in the sixth position.
The greatest thing about ASH (GV$ACTIVE_SESSION_HISTORY and/or DBA_HIST_ACTIVE_SESS_HISTORY) is that you can drill down into the data, like a magnifier, allowing you to find the needle in the haystack.
The client’s DBA team knew which business function was suffering from performance issues. With that in mind, they shared the table name with me. So, before using dashtop.sql again, let’s first get all object IDs for the table and its indexes (table name changed for security reasons):
select listagg(object_id,',') object_id
from (select object_id from dba_objects where object_name='TABLE_BLABLABLA' and object_type = 'TABLE'
union all
select object_id from dba_objects where object_name in (select index_name from dba_indexes where table_name='TABLE_BLABLABLA'));

OK, so why get all object IDs for the table and its indexes?
The answer is that ASH has a column named CURRENT_OBJ#, which basically represents the object ID of the object that the session is currently referencing. This information is only available if the session was waiting for Application, Cluster, Concurrency, and User I/O wait events. It maps to V$SESSION.ROW_WAIT_OBJ#.
Now, let’s use dashtop.sql one more time, but this time filtering only the SQL statements that were hitting any of the object IDs we need:
@dashtop "session_state,event,sql_id" "session_type='FOREGROUND' and current_obj# in (77274,110640632,60137509,79989,79990,79991,79992,79993,79994,79995,79996,79997,79998,79999,80000,98334096)" "TO_TIMESTAMP('10-03-2025 17:45:00', 'DD-MM-YYYY HH24:MI:SS')" "TO_TIMESTAMP('10-03-2025 18:15:00', 'DD-MM-YYYY HH24:MI:SS')"
Great! Now we can see that the same SQL query that was third in the main database picture now appears first, with the DB spending 47% of its time on it. We can also see that another SQL statement, which was sixth in the main database picture, now appears second, with DB spending 27% of its time on it. Both cases made it to the top when we filtered by objects.
Together, these two SQL statements were responsible for 74% of the database time spent on that table or its indexes.
Then, I used sqlstat.sql to try to get some historical information. The usage is really simple:
@sqlstat <sql_id> <number_of_days>
So, I retrieved the history for the last 60 days for the first query:
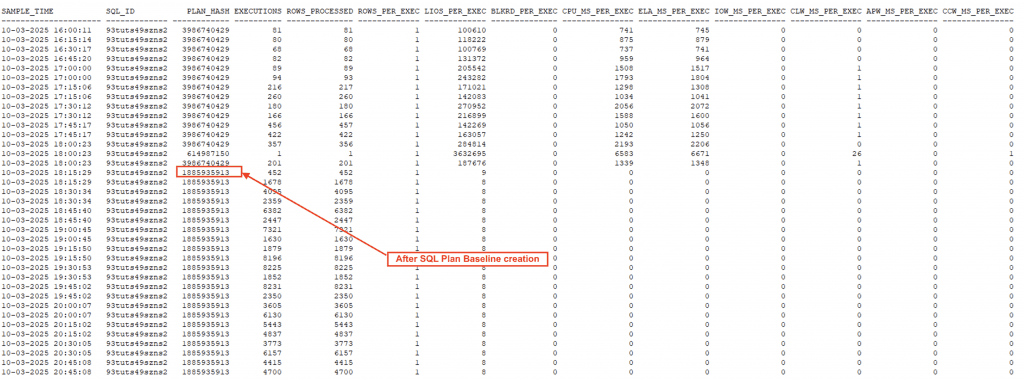
@sqlstat 93tuts49szns2 60

We can clearly see that the execution plan changed after the migration, and the one chosen by the optimizer was not a good plan. 🙂
After we identified the issue, the DBA team was able to create a SQL Plan Baseline to enforce the good plan. We can see that after their action, the SQL statement now performs much better:
@sqlstat 93tuts49szns2 60
If you noticed, thanks to the information available in ASH (and thanks to Tanel for creating such a great script), I was able to quickly find the issue!
Hope it helps!
Vinicius